Kate Ravilious’s contribution to the Weatherwatch column in last Saturday’s Guardian mentioned a silly comment piece Boris Johnson wrote for the Telegraph a couple of weeks ago, reminding me to post my own response. Boris’s (or possibly a Telegraph editor’s) title says it all: “It’s snowing and it really feels like the start of a mini ice age”.
When Boris’s piece first appeared the Guardian Environment blog’s Leo Hickman was quick to post a rejoinder and the London Mayor’s contribution to climate science is still attracting (adverse) comment and not just at Uncharted Territory. Jenny Jones asks this morning whether “Boris Johnson’s climate flippancy translates into policy failure”.
When I first read Boris’s blather I was puzzled by his comment on the latest science:
“I see from the BBC website that there are scientists who say that ‘global warming’ is indeed the cause of the cold and snowy winters we seem to be having. A team of Americans and Chinese experts have postulated that the melting of the Arctic ice means that the whole North Atlantic is being chilled as the floes start to break off — like a Martini refrigerated by ice cubes.”
It seems Boris has conflated two research ideas:
(1) James Hansen suggests that the Greenland ice sheet could break up faster than expected because current estimates are based on historic “forcing” (extra energy gain by Earth) whereas we’re warming the planet up much faster. The main worry would be more rapid sea-level rise than currently estimated later this century, but a side-effect would be the “Martini effect” Boris refers to. But no-one (except Boris) is suggesting this is “the cause of the cold and snowy winters we seem to be having”. The North Atlantic is not full of ice-bergs. The suggestion is that this might occur a few decades hence.
(2) The theory Ravilious refers to in her Weatherwatch piece that loss of Arctic sea ice has disrupted Northern Hemisphere winter weather patterns:
“Xiangdong Zhang, a climate scientist at the University of Alaska Fairbanks, analysed the weather patterns over the last thirty years and has shown that the extreme winters are associated with a strong Siberian high pressure system, hovering over Eurasia, which sucks cold polar air down to mid latitudes.
In the journal Environmental Research Letters, Zhang and his colleagues explain how Siberian highs have intensified, possibly due to warmer Arctic temperatures and thinner sea ice. Temperature redistribution, and weakening mid-latitude westerlies, help to spin up stronger Siberian winter highs. So it seems colder winters will remain.”
The point is clear when we look at one the Arctic ice maps provided by the NSIDC (the US’s National Snow and Ice Data Center):

This is the latest image, but any other day over the last few months would have told the same story.
The theory as I understand it is that the lack of insulating ice, particularly in the areas highlighted, results in warmer than usual temperatures. This disrupts weather patterns. One way of looking at it is that the warmer air results in lower pressure (warm air rises). Since everything is relative this tends to intensify the usual high pressure systems over Greenland and Eurasia, blocking the normal westerly air flow. Another way is to consider how close the warm water is to the pole. The Earth being spherical (sorry, I need to point this out for Boris!) air wants to circulate along lines of longitude. The warm area of sea disrupts the circulation, letting cold polar air escape.
The upshot for the UK is a greater likelihood of polar air masses being steered our way by a northerly air-stream circulating around the Greenland high (as in December 2010 and indeed just now – see the Met Office weather map below), or the Eurasian high extending over Scandinavia and sending easterlies over us (as in January this year).
Having set up a rather fragile straw man – the “Martini” theory that isn’t intended to explain our current winter weather anyway! – Boris dismisses it and, with his usual hyperbole suggests it’s all to do with the Sun:
“As a species, we human beings have become so blind with conceit and self-love that we genuinely believe that the fate of the planet is in our hands — when the reality is that everything, or almost everything, depends on the behaviour and caprice of the gigantic thermonuclear fireball around which we revolve.”
Sigh!
There are a couple of problems for Boris:
(1) Winter weather in the UK depends on the direction it is coming from. So any theory needs to explain how that can change and not simply assert that:
“When the solar acne diminishes, it seems that the Earth gets colder. No one contests that when the planet palpably cooled from 1645 to 1715 — the Maunder minimum, which saw the freezing of the Thames — there was a diminution of solar activity. The same point is made about the so-called Dalton minimum, from 1790 to 1830. And it is the view of Piers Corbyn that we are now seeing exactly the same phenomenon today.”
though he does go on to argue – not very convincingly – that:
“Lower solar activity means – broadly speaking – that there is less agitation of the warm currents of air from the tropical to the temperate zones, so that a place like Britain can expect to be colder and damper in summer, and colder and snowier in winter.”
Hold the next IPCC report! We need to include Boris’s chapter on “agitation”!
(2) It’s not actually been that cold this winter!
I like the Central England Temperature (CET) record because it provides a decent length series of data. The mean temperature figure for January 2013 has just been published. It was only 0.3 below the 1961-90 average. This was because whilst the middle of the month was reasonably cold – not bitter like December 2010, but enough to snow – both the start and end of the month were very mild. I recollect the average for the first 8 days was 4.5C above usual, and that the temperature in the London area (I usually look at the data for Heathrow) approached 14C one day near the end, which won’t have been far off the UK record for the date (these vary from 15-18C in late January).
To put it in a nutshell, we’re getting very mild spells as well as colder spells. Determining whether this behaviour is more pronounced than in the past would require considerable research effort, but everyone agrees that we have had more cold snaps and snow in the last few years than in the previous twenty or thirty. But both general global warming and disruption of the circulation drawing air from further south than usual over the UK may be giving us milder mild spells so that the average winter temperature is not that different to that in the past.
It might be worth pointing out that whilst Boris’s ramblings after some snow during a not particularly cold cold snap have been highly publicised and debated, I struggle to recall a single article in the Telegraph, Express or Mail exclaiming how astonishingly mild it was in the first week or so of January. Or indeed a great deal of comment about the freakishly warm month of April 2011. Perhaps a masters student could write a dissertation comparing the number of column inches and TV documentary minutes on the record April with those discussing December 2010.
As Ravilious suggests, though, the recent cold and cold-ish winters have not just been media hype – there is a real-world phenomenon to explain. So let’s adopt as a working hypothesis the proposition that the high latitude Northern Hemisphere atmospheric circulation has become disrupted, as suggested by Xiangdong Zhang and then look a little more at recent temperatures.
The changes in circulation affect much of the whole Northern Hemisphere (at least), of course, but we’re only really interested in the UK. In fact just the London area, to be blunt!
It seems to me a consequence of Zhang’s theory that the air would flow more north to south than west to east compared to previously. A huge research project could be set up to try to confirm this by analysing isobars on weather maps over the last few decades. Are the lines more N-S than W-E compared to before? Are N-S lines longer than they were (implying air is moving across a greater range of latitude)? I await someone taking up this suggestion and publishing the results. In the meantime, anecdotal evidence will have to do. I noticed how much the BBC weatherman on Monday evening was taken with how cold air was moving right down over the UK, through France and Spain to North Africa. He excitedly presented a chart rather like this one from the Met Office (I added the blue arrows indicating the cold air flow):

The effect of this cold air will indeed be felt in North Africa, as shown on these maps from the Wetterzentrale site:
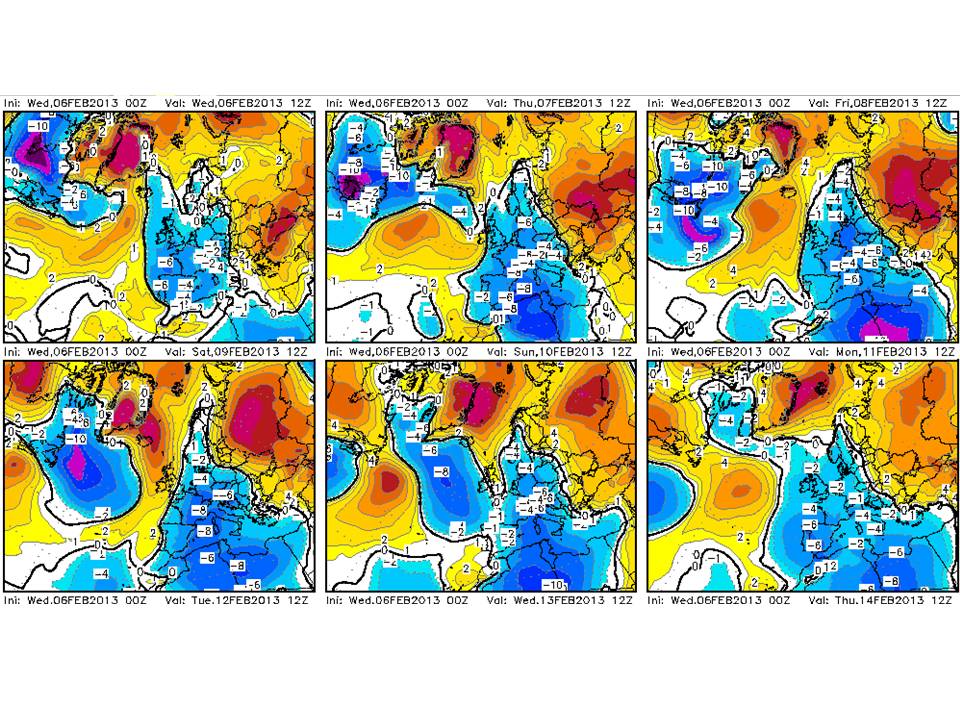
The purple area in the map for Friday indicates where temperatures are expected to be 10C below usual for the time of year.
Increased disruption of the usual westerly airflow over the UK may not cause uniformly cold winters, because, whilst the air can flow west to east (at least at our latitude), any flow north to south must be accompanied by a (moreorless) equal and opposite flow from south to north. Somewhere is going to be very mild when we’re very cold and sometimes we’re going to be mild when somewhere else is cold. Whilst this and the general effect of global warming neatly explains why this winter’s been surprisingly mild, considering all the snow, the question is whether or not we can in general expect more or fewer than our fair share of cold spells in winter or at any other time of year. Again, proper research is required, but one suspects that most of the colder than average months over the last few years in the CET have occurred in winter.
Given that the planet is generally warmer, the mild spells we do get over the year do seem to generally outweigh the cold spells when we calculate an average temperature. Here, thanks to the Met Office again, are the monthly CET figures since the start of 2010:
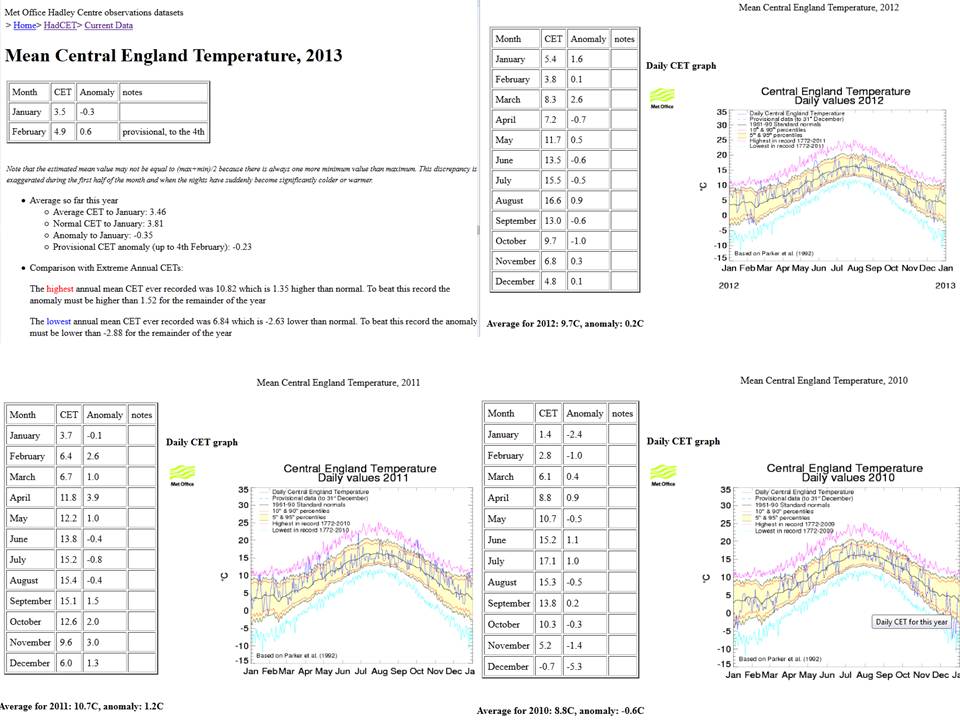
Sorry – I’ve made this image huge, as I’ve jammed a lot into it.
The only months over these three and a bit years that have been 1C or more colder than usual were January, February, November and December 2010 and October 2012. In contrast 12 months have been 1C or more warmer than usual, 8 of them during 2011! There have been 2 freak months – December 2010 at a staggering 5.3C colder than the mean and April 2011 at 3.9C warmer.
This small sample is intended to merely illustrate the point rather than prove anything statistically, of course. Still, one might tentatively suggest that recent weather patterns – perhaps connected to the disappearance of Arctic sea ice – favour colder winters in the UK than would otherwise be the case and milder springs and autumns.
—————–
I thought I’d finish up by speculating whether the winter 2012-13 temperatures are going to be at all notable. Compared to December 2010 and even winter 2009-10 it’s all fairly pathetic (despite the usual hyperbole in the tabs, the Express generally the most sensationalist).
The models are forecasting the cold weather to continue for a while yet:
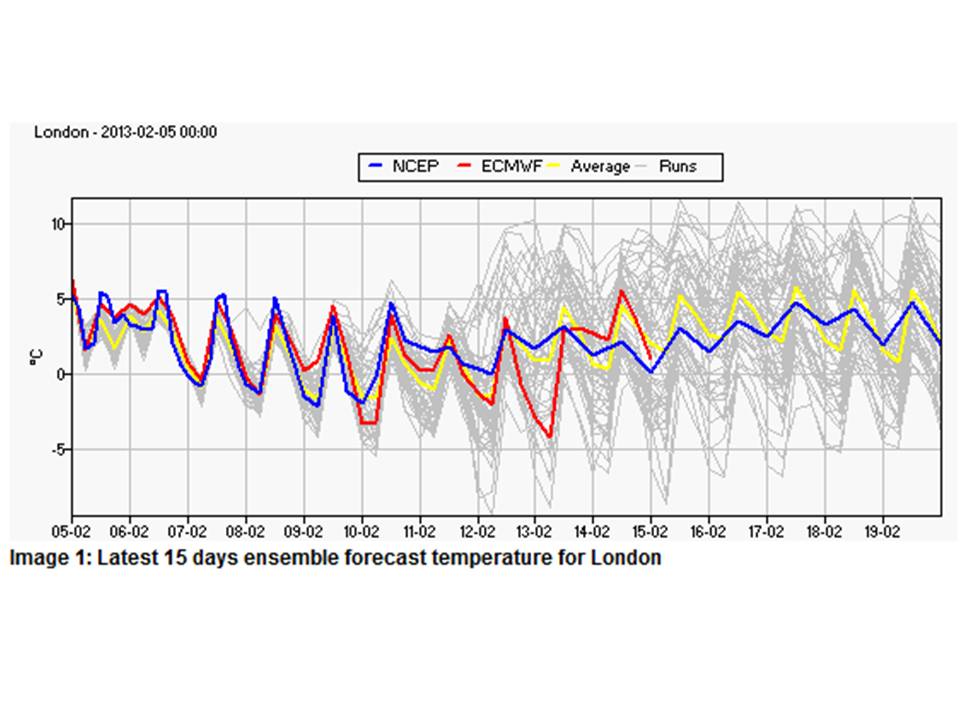
This is for London, which is likely to be warmer than the CET area. Mean temperatures therefore look like staying below the 3.8C average for February for a week or two.
Further out, I haven’t seem any model runs showing anything very mild. Many show cold easterlies developing over the UK, as in these snapshots from the ECMWF site (their model) and Weatheronline (the GFS model):


Be interesting to see how accurate these turn out to be.
The Met Office is currently suggesting colder than usual weather is most likely for the rest of February:
“UK Outlook for Monday 11 Feb 2013 to Wednesday 20 Feb 2013:
It is likely to be cloudy for many central, southern and western areas through Monday with outbreaks of rain, sleet and snow clearing slowly south as the day progresses. Elsewhere, it should be drier and brighter with a few wintry showers, especially towards North Sea coasts. Most places are likely to be mainly dry, bright and cold through Tuesday with overnight frost and ice an ongoing risk. Gradually turning more unsettled again from mid-week onwards with outbreaks of rain spreading southeastwards, with the chance of this turning to sleet and snow at times, especially over hills. Perhaps becoming a little less cold but staying rather unsettled for the remainder of the period, with an ongoing risk of sleet and snow, especially across higher ground.
UK Outlook for Thursday 21 Feb 2013 to Thursday 7 Mar 2013:
There are large uncertainties at this forecast range. Conditions will most likely start with temperatures close to or a little below average, with fairly typical winter weather across much of the UK. There are signs that a slightly colder spell may then prevail throughout much of the rest of the period, with more widespread overnight frosts.
Issued at: 0400 on Wed 6 Feb 2013”
So it seems fairly likely that February 2013 will at least be less than 0.2C warmer than average. With December 2012 0.1C warmer and January 0.3C cooler that would make winter 2012-13 colder than the historical average (over 1961-90). Even this is by no means certain, even though everyone, especially Boris, is saying what a severe winter it’s been. It just goes to show how much we got used to milder winters through most of the 1990s and 2000s.
We might also consider how the colder winters are affecting annual CET means. The graph provided by the Met Office shows that years below the long-term mean are now rare, 2010 being the only one so far of the third millennium:

2012 wasn’t far off, though, and a glance at the data (in the big picture, above), shows that it would have been below average but for March, which was 2.6C above the mean for the month. It therefore seems there is a good chance of the year April 2012 through March 2013 being cooler than the long-term or pre-global warming mean, which is worth at least a footnote in the interesting weather records of the 2010s. Watch this space!
My previous post on weather/climate called 2012 as not the warmest year in the CET. This was as early as last July, which was bold of me. The reason the record is significant is that climate change sceptics expect each year to be warmer than the last. Such an expectation is unwarranted, of course, but nevertheless a record year, albeit only in the CET, might shut them up for a while. Last year I remember thinking in mid-Feb that the record might not be on, since a cold snap had more than offset January (1.6C above the mean) so that the year as a whole was at the mean. If the rest of February had been even average, it would have meant the average for the rest of the year would have had to have been 1.6C above the mean in order to break the record, which seems less likely than the whole 12 months being 1.35C above. But one of those mild spells in the second half of February offset the cold spell in the first half. With that in mind, it’s too early to start saying the record is unlikely this year. This is what the Met Office are currently saying:
“The highest annual mean CET ever recorded was 10.82 which is 1.35 higher than normal. To beat this record the anomaly must be higher than 1.53 for the remainder of the year.”
Back to the day job…

[…] Temperatures for the winter as a whole are also worthy of discussion. I wrote last time that: […]
Pingback by The Severe Winter of 2012-13: 4th Coldest in 5 Years Shock! « Uncharted Territory — February 21, 2013 @ 4:56 pm
The CET warm record is very unlikely after the past few weeks of strong easterlies.
The main point of the climate change debate is that climate model predictions shape policies costing billions of pounds. What sort of policies? The high tax on petrol brings in about 50 billion pounds a year, or more, to the govt, and it’s basically a flat, regressive tax – a sort of poll tax for all of us using roads. The climate change argument is used as justification, and environmentalists are in bed with those holding right-wing tax views, though I’m sure they don’t choose such bedfellows.
So, we look at the model predictions for UK and they predict milder, wetter winters, and warmer, drier summers. This is the basis for the green flat tax?
Comment by John — April 6, 2013 @ 5:30 pm