Uncharted Territory

July 24, 2018

Summer 2018: UK’s Hottest Ever?

Filed under: Effects, Global warming, Media, Science, Science and the media, UK climate trends — Tim Joslin @ 9:52 pm

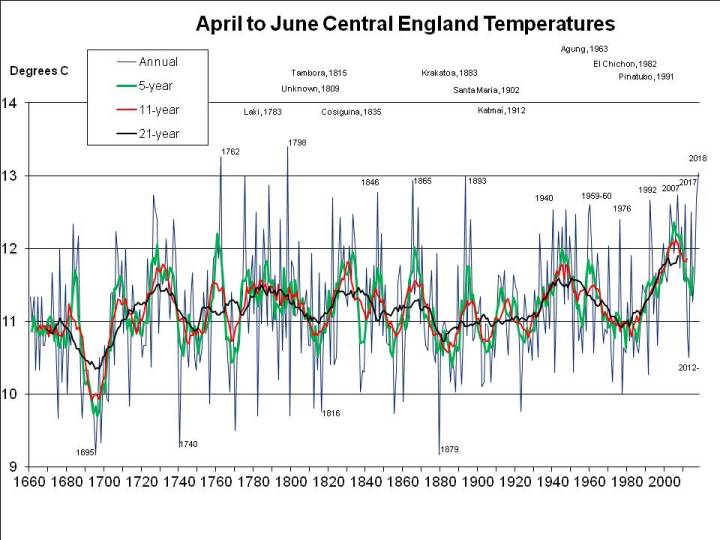
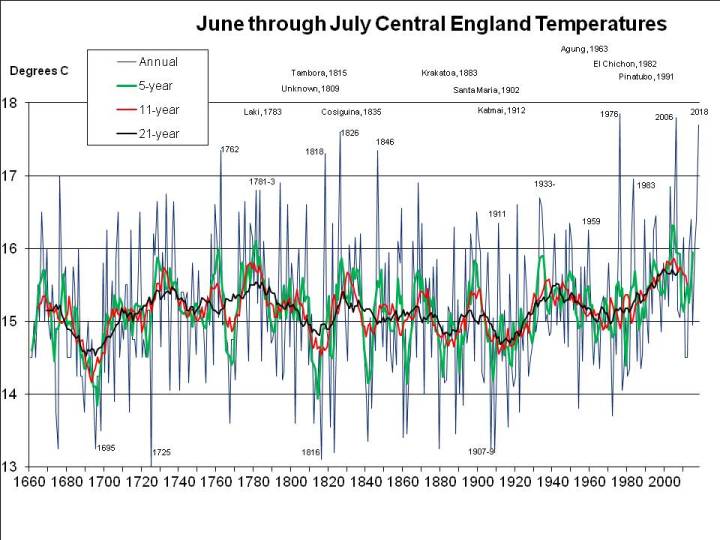
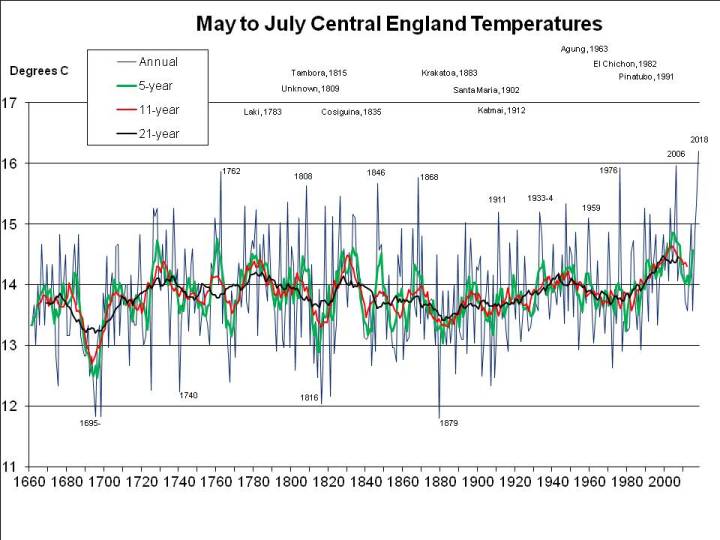
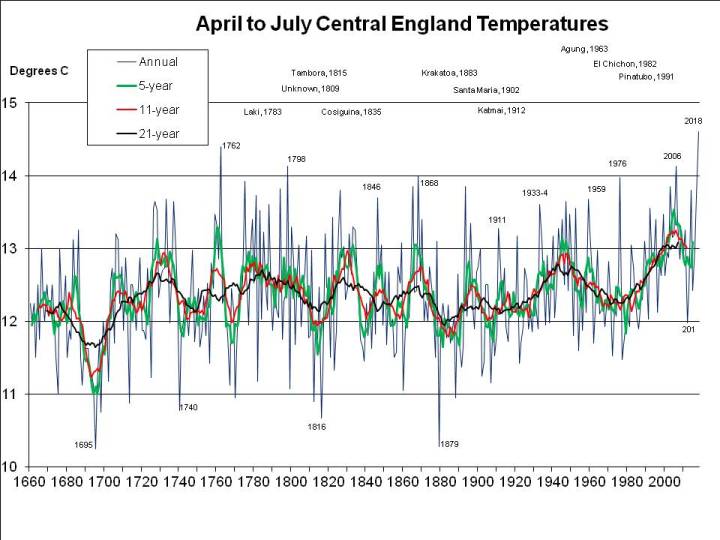
2018 is already notable (pending final data for July) for the hottest May to July and the hottest April to July in the entire 360 years of the Central England Temperature (CET) record, as the graphs in my previous post show so eloquently. Nevertheless, besides foaming at the mouth that Englishmen are being advised not to go out in the mid-day sun (optional musical interlude), certain sections of the media are speculating rabidly as to whether 2018 could be the hottest summer ever. The Express, for example, announces that “Summer 2018 [is] on track to beat ALL RECORDS as HOTTEST day looms”, though neither the article, nor the accompanying Met Office video, quite say that.

When the media, and especially the Met Office, refer to “summer” they mean June, July and August. So pedantic. It can be nearly as hot in the UK in May and September, so comfortably the hottest May through July recorded in 360 years seems more significant to me than barely the hottest June through August.

Especially as the main feature of this summer is the lack of any significant breaks in the weather as opposed to the sheer heat – unless I’ve not been paying attention we don’t seem to have broken a single daily record for the UK as a whole so far. I went so far as to question in my post reporting on a fairly warm June whether we were experiencing a heatwave or just warm weather. I’ll grant, though, that this week, with peaks consistently over 30C here in London, does feel unpleasantly like a “heatwave”. And at least one daily record high may be anticipated.

So what are the chances of June to August, “summer”, being the hottest ever in the CET? Simple: the CET mean for August needs to be 18C or higher. I’ve put 18C in the data for August and produced this graph:
180724 June to August CET graph to 2018 border
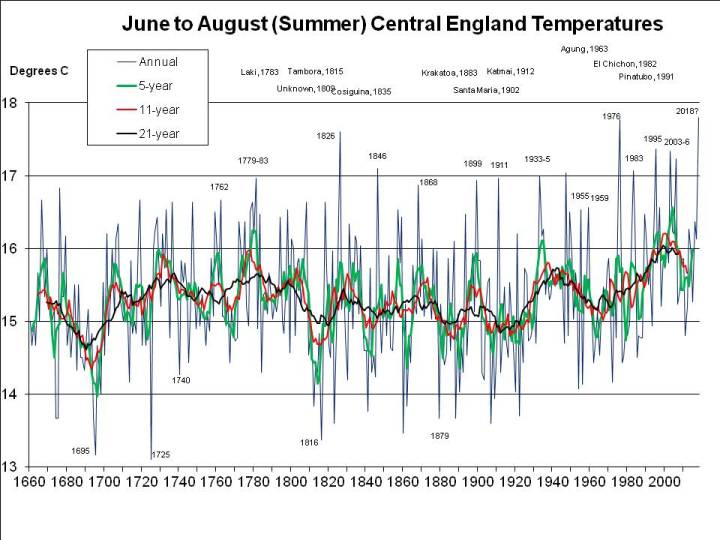
This shows that if the CET mean for August is 18C, summer 2018 will average 17.8C in that series, just pipping 1976’s 17.77C and the 17.6C recorded in 1826.

There are a couple of assumptions. First, I still have 19.3C as the figure for July. The Met Office page is currently showing 19.4C up to 23rd, so 19.3C should be safe enough, since the next few days are likely to drag up the average for the month, although the figure can change by a few tenths right at the end of the month. I understand this to be because data from remote weather stations comes in late and I’ve noticed that the monthly figure is usually adjusted downwards, at least in winter.  Second, the figure for June was adjusted down significantly (which caught me out somewhat), but that this has been queried. Obviously if that adjustment was erroneous and the June figure is revised upwards (which I don’t expect to happen), then August doesn’t need to be so hot for 2018 to break the summer record.

But how usual is an 18C mean in the CET for August? That presents the opportunity for another graph!:
180724 June to August CET graph to 2018 border
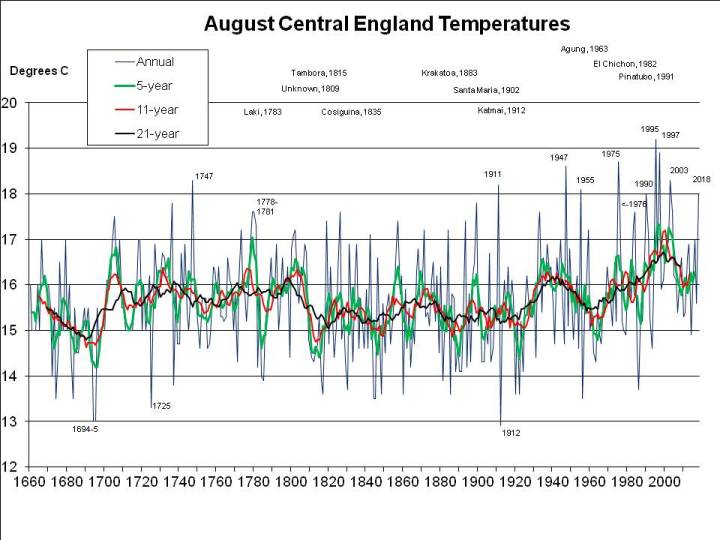
As can be seen, 18C in August was pretty unusual for two or three centuries and not even achieved in 1976, which only managed 17.6C. But in the global warming era 18C is very possible, provided, of course, that current weather patterns continue.  If they don’t everyone will be wishing they’d trumpeted the record spring-into-summer heat!

July 22, 2018

July 2018 UK Weather: CET Records Set

Filed under: Effects, Global warming, Science, UK climate trends — Tim Joslin @ 2:51 pm

Last month I jumped the gun to report the hottest UK June since 1976 in the Central England Temperature (CET) record.  I was slightly undone by a slight downward revision so that in the event June 2018 was only equal with that in 2003 as the warmest since 1976.  Despite that, the forecast for another week of temperatures reaching the 30Cs and the CET for July to date of significantly over 19C prompts me to call July 2018 even earlier as one of the three hottest on record in the CET.  Here’s a graph (the first of many, so be prepared!):
180722 July CET graph to 2018
Only 2006 (19.7C), 1983 (19.5C) and now 2018 (the CET so far this month was 19.3C when I prepared this graph) have exceeded 19C in the CET (thanks, as ever, to the Met Office for the data). In fact, since the next hottest July was in 1783 at 18.8C – which should possibly even be discounted on the grounds that the heat was in part the effect of volcanic smog from the Icelandic volcano Laki – some wintry weather indeed would be necessary for July 2018 to now not be one of the three warmest, justifying my early call (though there’s a huge getting round to it factor in that!).

What is also striking about the July temperature graph is that the three hottest Julys – 2006, 1983 and 2018 – are all in the global warming era. Of course.

I’ve also labelled some notable years in this and subsequent graphs. In particular, I read articles drawing 1955 and 1911 to my attention. Ian Jack wrote nostalgically about 1955, though I do wonder if its impact was magnified by his age at the time. I’d personally rank 1983 – one of the few summers when I played tennis regularly – as up there with 1976. And I’m backed up by the CET data!

A brilliant Weatherwatch column in the Guardian (better even than the one of 2011 on the same topic) reports on the summer of 1911. It’s worth quoting:

“The long hot summer of 1911 is credited with changing fashions, with women shedding whalebone corsets and brassieres becoming the rage. Edwardian [sic, though Edward VII died in 1910] aristocrats are said to have taken up nude tennis at their country estates…

There was record heat in August and the sunshine continued until September, by which time the countryside was also in severe distress and riots had broken out in the cities.”

Time will tell if we’re in for a repeat!

So onto the graph-fest.

I was going to follow up last month’s post with one of the April to June CET, having noticed that the hot June had followed a distinctly mild mid to late spring (despite cold snaps continuing). Anyway, here’s that one, a little belatedly:
180722 Apr to Jun CET graph to 2018
Yep, that’s right, April to June this year has been one of the three warmest such periods in the CET record, exceeded only by 1762 and 1798. Crikey!

Then, of course, a hot June followed by an exceptionally hot July must make the early to mid summer graph (June and July) quite interesting:
180722 June to July CET graph to 2018
It is, but 2018 is still only the third hottest year, after 1976 and 2006 this time (though 2018 could still also fall behind 1826, I suppose).

Surely there must be some measure on which 2018 is (provisionally) the warmest ever?

Yes, you’ve guessed it. A mild late spring and hot early to mid summer makes 2018 a record-breaker for May to July mean CET:
180722 May to July CET graph to 2018

And that’s not it. If we add in April as well, sort of mid-spring to mid-summer, it’s not even close:
180722 April to July CET graph to 2018
Bingo!

Create a free website or blog at WordPress.com.