Uncharted Territory

April 9, 2013

Could 2013 Still be the Warmest on Record in the CET?

Filed under: Global warming, Science, UK climate trends — Tim Joslin @ 5:05 pm

Blossom is appearing and buds are opening. The front garden magnolias of West London are coming into flower. The weather is turning milder in the UK. Spring is here at last.

So perhaps I’ll be coming to the end of posts on the subject of unusual weather for a while. Until there’s some more!

We’ve seen that March 2013 was, with 1892, the equal coldest in the CET since 1883, which is particularly significant given the generally warmer Marches in recent decades.

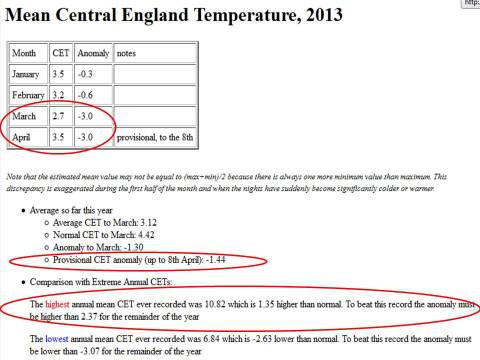
The first quarter of 2013 was the coldest since 1987, and the cold has now continued into April. This is where we now are, according to the Met Office:

130409 Latest weather slide 1

So far this year it’s been 1.44C colder than the average over 1961-90, which is the basis for CET “anomalies” here.

The rest of the year would have to be 2.37C warmer than usual, on average, for 2013 to be the warmest in the record.

Is it possible for 2013 to still be the warmest year in the CET? I’m saying no – or, to be more measured, it’s extremely unlikely.

Last year, it was July 13th before I felt able to make a similar statement.

But now I’ve realised that I can simply plot a graph of the later parts of previous years and compare them to the required mean temperature in 2013.

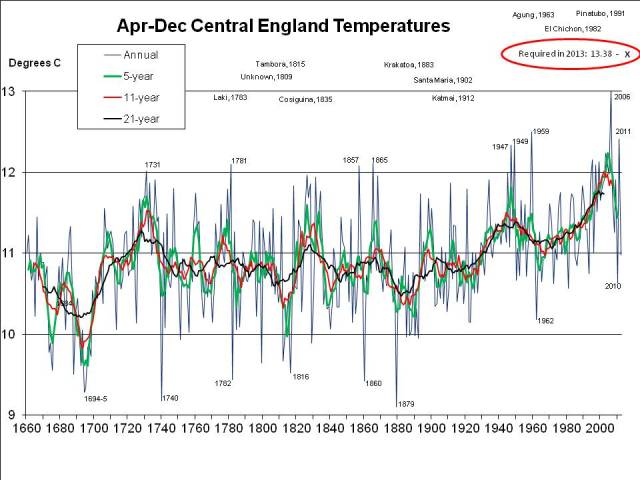
Here’s the graph of mean CET for the last 9 months of the year:

130409 Latest weather slide 2

Perhaps the most notable feature is that the last 9 months of 2006, at 13C were a whole 0.5C warmer than the last 9 months of the next warmest year, 1959, at 12.5C!

It’s easy enough to calculate that for 2013 to be the warmest year in the CET, the mean temperature for the last 9 months of the year would have to be 13.38C.

To be warmer than the warmest year in the CET, also 2006, the last 9 months of 2013 would need to be 0.38C warmer than the last 9 months of 2006. That’s a big ask.

But let’s look a little more carefully at 1959. The last 9 months of 2009 were about 1.4C warmer than the prevailing mean temperatures at the time, given by the 11 year (red line) and 21 year (black line) running means. The last 9 months of 2006 were “only” about 1.1 or 1.2C warmer than an average year at that time.

If 2013 were 1.4C warmer than the running means in previous years (obviously we can only determine the running means centred on 2013 with hindsight) then it would not be far off the warmest year in the CET.

No other year in the entire CET spikes above the average as much as 1959, so we have to suppose the last 9 months of that year were “freak” – say a once in 400 year event – and extremely unlikely to be repeated.

So on this basis it seems 2013 is extremely unlikely to be the warmest in the CET.

Now we have a bit of data for April we can also carry out a similar exercise for the last 8 months of the year.

The Met Office notes (see the screen-grab, above) that the first 8 days of April 2013 were on average 3C cooler than normal in the CET (“normal” with respect to the CET is always the 1961-90 average). If we call those 8 days a quarter of the month, the rest of the month needs to be 1C warmer than usual for April as a whole to be average. Let’s be conservative, though, and assumes that happens.

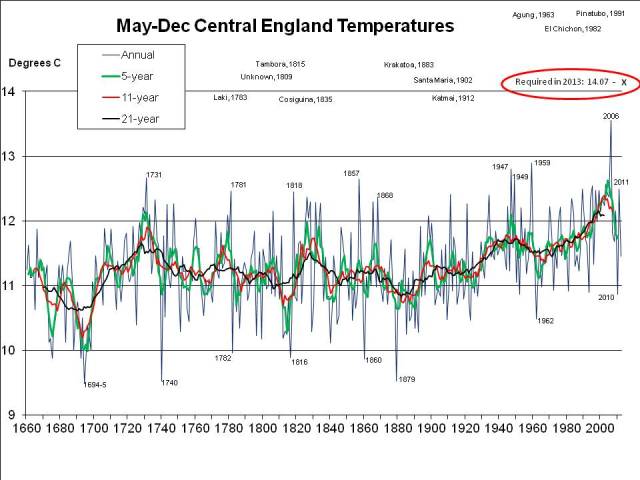
It’s easy enough now to calculate that for 2013 to be the warmest year in the CET, the mean temperature for the last 8 months of the year would have to be 14.07C, assuming the April temperature ends up as the 1961-90 average.

On this basis, we can then compare the last 8 months of previous years in the CET with what’s required for this year to be the warmest on record:

130409 Latest weather slide 3

Here 2006 seems more exceptional, and 1959 not quite such an outlier. (April is not now included: in 1959 the month was warm at 9.4C whereas in 2006 it was warmer than average at 8.6C, but not unusual).

Clearly, the spike above the running means would have to be a lot higher than ever before for 2013 to be the warmest year in the CET. Those 8 cold days seem to have made all the difference to the likelihood of 2013 breaking the record.

That’s it for now – though if April is particularly cold this year, a comparison of March and April with those months in previous years will be in order. The plot-spoiler is that 1917 was the standout year in the 20th century for the two months combined.
April 8, 2013

CET End of Month Adjustments

Filed under: Global warming, Media, Science, Science and the media, UK climate trends — Tim Joslin @ 5:51 pm

When we have some exceptional weather I like to check out the Central England Temperature (CET) record for the month (or year) in question and make comparisons with historic data which I have imported into spreadsheets from the Met Office’s CET pages.

The CET record goes back to 1659, so the historical significance of an exceptionally cold or warm spell – a month, season, year or longer – can be judged over a reasonably long period. Long-term trends, such as the gradual, irregular warming that has occurred since the late 17th century, are, of course, also readily apparent. The Met Office bases press releases and suchlike on records for the UK as a whole which go back only to 1910.

The Met Office update the CET for the current month on a daily basis, which is very handy for seeing how things are going.

After watching the CET carefully during a few extreme months – December 2010 and March 2013 come to mind – I noticed that there seems to be a downwards adjustment at the end of the month. I speculated about the reasons for the apparent correction to the figures a week or so ago:

“…I’ve noticed the CET is sometimes adjusted downwards before the final figure for the month is published, a few days into the next month. I don’t know why this is. Maybe the data for more remote (and colder) weather-stations is slow to come in. Or maybe it’s to counter for the urban heat island effect, to ensure figures are calibrated over the entire duration of the CET.”

and, as I mentioned earlier, today emailed the Met Office to ask.

I received a very prompt reply, and the first of the possible explanations I came up with is in fact correct. My phrase “more remote” makes it sound like the data is still being collected by 18th century vicars and landed gentry, but in fact there is a bias in the daily CET for the month to date due to the timing of availability of data:

“Not all weather stations send us their reports in real time, i.e. every day, and so for some stations we have to wait until after the end of the month before [complete] data are available.”

It must simply be that the stations that send in the data later tend to be in colder areas (at least in winter when I’ve noticed the end of month adjustment) – perhaps they really are “more remote”!

March 2013 WAS equal with 1892 as coldest in the CET record since 1883!

10 days or so ago I discussed the possibility that March 2013 would turn out to be the coldest in the Central England Temperature (CET) record since the 19th century.

Well, it did it!

Here’s a list of the coldest Marches since 1800 in the CET:

1.   1883  1.9C
2.   1845  2.0C
3.   1837  2.3C
4= 1892  2.7C
4= 2013  2.7C
5.   1962  2.8C

A few questions and not quite so many answers occur to me:

1. Why hasn’t the Met Office trumpeted March 2013 as the coldest since the 19th century?
What I’m alluding to here is, first, that the Met Office records for the UK and England only go back to 1910, but also that, as detailed on the Met Office’s blog, it turns out that March 2013 was only the joint 2nd coldest for the UK as a whole:

“March – top five coldest in the UK
1 1962 1.9 °C
2 2013 2.2 °C
2 1947 2.2 °C
4 1937 2.4 °C
5 1916 2.5 °C”

and second coldest for England as a whole:

“Looking at individual countries, the mean temperature for England for March was 2.6 °C – making it the second coldest on record, with only 1962 being colder (2.3 °C). In Wales, the mean temperature was 2.4 °C which also ranks it as the second coldest recorded – with only 1962 registering a lower temperature (2.1 °C). Scotland saw a mean temperature of 1.3 °C, which is joint fifth alongside 1916 and 1958. The coldest March on record for Scotland was set in 1947 (0.2 °C). For Northern Ireland, this March saw a mean temperature of 2.8 °C, which is joint second alongside 1919, 1937, and 1962. The record was set in 1947 (2.5 °C).”

The figures all tally suggesting that the parts of England not included in the CET were less exceptionally cold than those included, as I suggested before.

2. Why hasn’t the Met Office trumpeted March 2013 as the second coldest on record?
What I’m alluding to here is that the Met Office only made their “second coldest” announcement on their blog, not with a press release. The press release they did issue on 26th March was merely for “the coldest March since 1962”, and included somewhat different data to that (above) which appeared on their blog for the whole month:

“This March is set to be the coldest since 1962 in the UK in the national record dating back to 1910, according to provisional Met Office statistic [sic].

From 1 to 26 March the UK mean temperature was 2.5 °C, which is three degrees below the long term average. This also makes it joint 4th coldest on record in the UK.

Looking at individual countries, March 2013 is likely to be the 4th coldest on record for England, joint third coldest for Wales, joint 8th coldest for Scotland and 6th coldest for Northern Ireland.” (my stress)

and a “top 5” ranking that doesn’t even include March 2013, which eventually leapt into 2nd place!:

“March – Top five coldest in the UK
1 1962 1.9 °C
2 1947 2.2 °C
3 1937 2.4 °C
4 1916 2.5 °C
5 1917 2.5 °C.”

As I’ve also mentioned before, it’s odd to say the least that the Met Office have formally released provisional data (and not the actual data!) to the media.

So I’ve asked them why they do this, by way of a comment on their blog:

“The Met Office’s [sic – oops] announced a few days ago that March 2013 was only the ‘joint 4th coldest on record’ (i.e. since 1910) rather than the joint 2nd coldest. This was based on a comparison of data to 26th in 2013 with the whole month in earlier years, which seems to me a tad unscientific.

Maybe it’s just me, but it seems that there was more media coverage of the earlier, misleading, announcement.

Why did the Met Office make its early announcement and not wait until complete data became available at the end of the month?”

I’ll let you know when I receive a response – my comment has been awaiting moderation for 4 days now.

3. Why was it not clearer from the daily CET updates that March 2013 would be as cold as 2.7C?
And what I’m alluding to here is the end of month adjustment that seems to occur in the daily updated monthly mean CET data. I’ve noticed this and so has the commenter on my blog, “John Smith”.

I didn’t make a record of the daily mean CET for March to date, unfortunately, but having made predictions of the final mean temperature for March 2013 on this blog, I checked progress. From memory the mean ticked down to 2.9C up to and including the 30th, but was 2.7C for the whole month, i.e. after one more day. At that stage in the month, it didn’t seem to me possible for the mean CET for the month as a whole to drop more than 0.1C in a day (and it had been falling by less, i.e. by 0.1C less often than every day). Anyway, I’ve emailed the Met Office CET guy to ask about the adjustment. Watch this space.

4. Does all this matter?
Yes, I think it does.

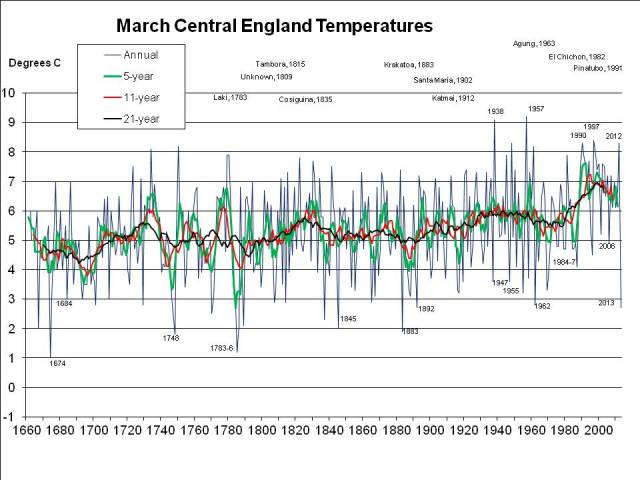
Here’s the graph for March mean CET I produced for the previous post, updated with 2.7C for March 2013:

130408 Latest weather slide 1 CET graph

A curiosity is that never before has a March been so much colder – more than 5C – than the one the previous year. But the main point to note is the one I pointed out last time, that March 2013 has been colder than recent Marches – as indicated by the 3 running means I’ve provided – by more than has occurred before (except after the Laki eruption in 1773).

I stress the difference with recent Marches rather than just March 2012, because what matters most in many areas is what we’re used to. For example, farmers will gradually adjust the varieties of crops and breeds of livestock to the prevailing conditions. A March equaling the severity of the worst in earlier periods, when the average was lower, will then be more exceptional and destructive in its effects.

The same applies to the natural world and to other aspects of the human world. For example, species that have spread north over the period of warmer springs will not be adapted to this year’s conditions.  And we gradually adjust energy provision – such as gas storage – on the basis of what we expect based on recent experience, not possible theoretical extremes.

OK, this has just been a cold March, but it seems to me we’re ill-prepared for an exceptional entire winter, like 1962-3 or 1740. And it seems such events have more to do with weather-patterns than with the global mean temperature, so are not ruled out by global warming.

Create a free website or blog at WordPress.com.