Uncharted Territory

March 24, 2010

Lloyds Share Price: What is it in old money?

Filed under: Economics, Lloyds, Markets, Rights issues — Tim Joslin @ 6:49 pm

As ever, none of the foregoing should be taken as financial advice – if you want that you’ll have to consult a professional – but I’ve noticed that a few people have recently found themselves in Uncharted Territory after searching for information about Lloyds shares.  I hope they aren’t trying to decide what to do about the rights issue because that’s long since all been and gone.  Maybe what people are looking for, though, is a conversion of the current share price to the pre-rights price.

The point is that, after an announcement last week that – hip-hip-hooray! – the bank is on course to actually make a profit this year, the shares have perked up to about 64p after dipping below 50p following the rights issue.  But how good a performance is this?

Back in November I discussed the theoretical ex-rights price (TERP) in a number of posts.   The bottom line is that prior to the rights issue Lloyds shares were trading at around 90p, but the effect of the new share issue meant that following the rights issue they would be expected to trade at around 60p.

60p would represent a “par” performance.  If demand for the shares increased following the rights issue – as a result of some good news, perhaps – then they’d trade at a higher price.

The question is what price would Lloyds shares have had to be trading at for the TERP to be 64p?

This is easily calculated.  We simply (1) multiply the current share price by the number of shares in circulation following the rights issue (but see Note 1 below), (2) subtract the funds (£13.5bn) raised by the rights issue (see also Note 2), then (3) divide by the number of shares before the rights issue.

(1) 64p * 63,666,770,945 = £40,746,733404.80 to be very precise (but see Note 1)

(2) £40,746,733,404.80 – £13,500,000,000 = £27,246,733,404.80 (but see Note 2)

(3) £27,246,733,404.80 / 27,161,682,366 = 100.31p

Obviously Lloyds share price tomorrow might be 65p or 63p, so a general calculation is needed.

Obviously, too, we could devise a formula, but it’s also simple to put a few columns in a spreadsheet and plot a graph:

So if Lloyds’ share price were to reach 70p, this would be very roughly equivalent to 115p before the rights issue.

The whole point of this exercise, of course, is that knowledge that there was an upcoming rights issue may have depressed the Lloyds share price before the rights were even issued. The additional issue of shares would be expected to depress the share price – supply and demand – and market participants may have anticipated this and sold some of their holdings in advance.

The following graph from Yahoo! Finance shows how Lloyds’ share price was trading in the run-up to the rights issue last November:

So, based on my calculation, the Lloyds share price at 64p is very roughly still in a range equivalent to the 100p at which pre-rights shares were trading at roughly at the start of last October.

Hope that’s helpful and feel free to point out any errors or criticise my assumptions, in particular those in the two Notes below.

———–
Note 1: My calculation ignores the further share issue since the rights issue. This diluted everyone’s holdings (including that of the Treasury, from 43% to 41%). It complicates the comparison of pre-rights and post-rights share prices, but because the latest issue was not at a significant discount I’ve assumed the effect can be ignored for a very approximate calculation.

Note 2: Only £13bn of the £13.5bn was available to the bank following the rights issue, which (scandalously) cost £500m. This is a complicating factor when comparing the post-rights price with the share price before the issue was announced. Personally, I’d be inclined to regard the £500m as money down the drain. The calculation, though, assumes it was money well spent and that shareholders received £500m of value for their £500m cash.

March 22, 2010

Ice Pie

Filed under: AMO, Global warming, Science, Sea ice — Tim Joslin @ 9:22 pm

I was prompted earlier to complete my previous post by an article in today’s Guardian which reported on “[n]ew research [that] does not question climate change is also melting ice in the Arctic, but finds wind patterns explain steep decline”.  The word “also” is confusing – you can hardly consider “climate change” to be entirely separate phenomenon from (changing) “wind patterns”.  I’m also a little confused as the paper by “Masayo Ogi, a scientist with the Japan Agency for Marine-Earth Science and Technology in Yokohama, and… colleagues… to be published in the journal Geophysical Research Letters” (presumably around now, 22/3/10) sounds strikingly similar to the one “led by Son Nghiem at NASA’s Jet Propulsion Laboratory” mentioned in January on a NYT blog, also “appearing this week [i.e. that of 13/1/10 when the blog entry was published] in Geophysical Research Letters”.

Anyway, the findings provide even more food for thought. The point is that:

“…winds have blown large amounts of Arctic ice south through the Fram Strait, which passes between Greenland and the Norwegian islands of Svalbard, and leads to the warmer waters of the north Atlantic. These winds have increased recently, which could help explain the apparent acceleration in ice loss.

‘Wind-induced, year-to-year differences in the rate of flow of ice toward and through Fram Strait play an important role in modulating September sea ice extent on a year-to-year basis,’ the scientists say. ‘A trend toward an increased wind-induced rate of flow has contributed to the decline in the areal coverage of Arctic summer sea ice.’

Ogi said this was the first time the Arctic winds have been analysed in such a way.

‘Both winter and summer winds could blow ice out of the Arctic [through] the Fram Strait during 1979-2009,’ she said.”

First, the idea is compatible with a natural Arctic sea-ice cycle.  In cold Northern Hemisphere (NH) winters – which, to recap, I suggest are more likely to occur when the Arctic sea-ice extent is less than usual at the end of summer – air pressure over Greenland (and other northern land areas) is relatively higher than usual.  The resulting anticyclonic winds would tend to drive ice down the east Greenland coast.  Once the trend reverses, not only would more ice form in the Arctic, the weather-patterns would also change and less ice would be blown out of the Arctic through the Fram Strait (east of N Greenland).  So the Atlantic Multi-decadal Oscillation (AMO) would be expected to include a see-saw in sea-ice to the west (Labrador Sea) and east of Greenland.  Maybe someone should check the history books.

Second, all this ice flowing (or should that be “floeing”?!) into the North Atlantic (NA) is a negative feedback.  It will contribute towards NA cooling, cutting off the flow of warm water into the Arctic, reducing ice melt.

Third, it might be worth noting that the mechanism involves the removal from the Arctic of fresh water (in the form of ice).   It’s conceivable that this could be important, as the saltier the surface waters in the Arctic, the colder the water will get before it freezes.  That is, the sea can lose more heat to the atmosphere, or by radiating it away, before freezing over and insulating the waters below from the atmosphere. Likely, more cold deep saline water will form too, driving the thermo-haline circulation (THC).  Maybe someone should do some maths to see how significant this effect is.

That Snow Calculation

Filed under: AMO, Global warming, Science, Snow cover — Tim Joslin @ 4:55 pm

I remain perturbed about the possibility that the recent rapid rate of Arctic sea ice melt is at least partly due to a natural cycle.  My hypothesis is that warming causes sea ice melt which causes cooling which restores the sea ice and so on.

Rather alarmingly, you can’t just subtract the natural cycle to obtain the global warming trend.  Instead, global warming interacts with the mechanisms driving the natural cycle, with uncertain but quite likely destabilising consequences.

If the hypothesis is correct, then there would (obviously) have to be mechanisms for the Earth to lose more heat when the Arctic sea ice extent is reduced.  This could happen in several ways.  One is that the Arctic may simply be warmer in the autumn and winter than it “needs” to be for the Earth to be in thermal equilibrium.  That is, without the insulating effect of the sea-ice at the end of summer, enough heat may simply be radiated away from the ocean waters into space to make a difference.

But it may also be the case that the absence of sea-ice changes weather patterns, in particular by causing cold winters in Europe and North America.  Essentially, instead of cold air remaining in the Arctic all winter, the circumpolar circulation breaks down and cold Arctic air cools the Northern mid-latitudes.  Obviously the cold air can’t cool everywhere at once – maybe one way of looking at the effect is to imagine air masses being cycled through the Arctic “fridge” – but it does tend to produce colder winters in the east of North America and in Europe.

During a cold Northern Hemisphere (NH) winter, the southerly winds which are the counterpart of northerlies tend to pass to the west of Greenland, and of North America, so Alaska for instance is warmer.  Or, to put it another way, the continental highs over Greenland, North America and Europe have more effect on the winter weather than usual.

The result is a lot more snow.  For example, the US eastern seaboard is affected by “nor-easters” – depression systems moving up the coast – dragging cold air down from the north inland, the resultant mixing leading to heavy snowfalls.  Heavy snow can also occur in Europe and indeed Asia.

How much effect could this extra snow have, compared to a normal winter?  The purpose of the following calculation is not to quantify the effect with any accuracy, merely to determine whether it could be significant.  It seems it could.

I asked in a previous post:

“What if 10m km2 snow cover persists for just one extra week?  Besides taking extra energy to melt (which turns out to be relatively insignificant), such a surface would reflect around 50% of incident sunlight relative to a year when the snow cover melted earlier.  At the latitudes (between about 60N and 40N) we’re talking about, a rough, order of magnitude, estimate is that at least 100W/m2 extra energy could be reflected (or used just in melting the snow) for a week.  10m km2 is about 1/25th of the total NH surface, so the snow effect alone is of the order of a negative forcing of around 4W/m2 over the entire NH surface, that is, more than the additional forcing of greenhouse gases, but only for one week of the year.   But if my calculation is too conservative, and in fact it’s several weeks over 20m km2 then we could be talking about a serious feedback.”

I now wonder if this is the right way to look at the problem.   The thing is, sunlight is reflected from snow whether it falls in London in December or Barcelona in March.  It might be possible to calculate the effect of all that snow without having to estimate how much longer snow cover remains in a cold winter.  All we have to assume is that the energy to melt the snow comes from sunlight falling on it.  This will be true for a large area of snow – only the border of such an area will be melted (or sublimed) by heat imported from surrounding land or especially sea (since the sea stores far more heat than the land).

Let’s take our extra 10 million km2 of snow in a cold winter and assume there’s an average of an extra 1m of snow over this area.  Warmer parts – London and Barcelona – will only receive an extra 10cm or so, but further north far more than an extra metre is conceivable.  I’ve had anecdotal accounts of snow depths of more than that, but the point is that this is the total over the winter – some will melt (or sublime) before spring and the snow will be replenished.

The “sublime”s I’ve put in brackets are important:

To melt 10m km2 of snow 1m deep takes: 10*10^6*1000*1000 (for km2 to m2)*100*100 (to cm2) *10 (estimating snow as 10% water)*334J = 3.34*10^20J.

But to sublime the same amount of snow takes ~2.6*10^21J because the latent heat of vaporisation of water is 2270J/g whereas the latent heat of fusion is only 334J/g (I’ve added the two latent heats to find the number for sublimation).

Now, a lot of snow sublimes, e.g. as a result of Chinook winds.  In general snow will sublime rather than melt if the air temperature is below 0C.  Let’s assume that half our snow sublimes as a result of incident sunlight during winter and spring.  This will absorb ~1.3*10^21J directly.

But, as I said in my previous post, this is not the major effect.  The big deal is the sunlight reflected while this process is going on.  The albedo of snow is 80-90% – call it 85%.  So only ~15% of the energy of sunlight is available to melt or sublime the snow.  The albedo of the ground absent snow is around 20% on average.  So even rounding down, 4x as much energy is reflected (85%-20% rounded down to 60%, divided by 15%) as goes into melting the snow.  This calculation is independent of the snow depth in any given location as well as how often lying snow disappears only to return over the course of the winter and spring.

The total energy cost to the planet of 5m km2 of on average 1m total snow cover is therefore about 5*1.3 – call it 6*10^21J, assuming all the energy to sublime it comes from incident sunlight.   This is equivalent to a continuous forcing over the ~250m km2 of the Northern Hemisphere (NH) of 6*10^21 / (250*10^6*10^6 to get metres squared*33*10^6 seconds in the year) = 6^10^21/8*10^21, i.e. about 0.75W/m2.

And we haven’t yet allowed for the other 5m km2 of snow that merely melts!

Since the forcing of greenhouse gases (GHGs) totals around 2.5W/m2, a 0.75W/m2 negative forcing is significant.  In fact, given that the Earth will have warmed to compensate for the GHG forcing, the albedo feedback of a cold NH winter may be enough to slow warming* and could even be enough to produce cooling against the warming trend. And this is in addition to the additional heat loss from the Arctic because of reduced sea-ice cover, which I discussed in one of my earlier posts on this topic.

—–

* Note that 2010 is an El Nino year, so the global average surface temperature may be warmer than in previous years despite the cold NH winter.

March 6, 2010

1740 And All That

Filed under: AMO, Global warming, Media, Science, Science and the media, UK climate trends — Tim Joslin @ 6:42 pm

The pain goes on.  The Met Office announced yesterday that they are giving up seasonal forecasts.  This is going to seem to most people – and I have to go along with the majority view on this – as if there’s something seriously wrong.  I don’t believe we’re dealing with butterflies’ wings here.  I simply don’t understand why it’s not possible to provide a broad brush indication of the weather in a coming winter or summer.  Presumably the right data is not available, and, from a cursory reading of the literature, what’s needed is a better picture of ocean temperatures at different depths.  I suggest that’s where resources must be focussed (and I gather plans are indeed afoot – codename Argo).  Because climate science needs to get out of the dog-house.

Managing the message

What we certainly don’t need is another PR disaster.

If Professor Latif’s prediction of a period of a decade or more of cooling either imminently or over the next decade or two is correct, then “we’ll have to eat crow” as one comment on a New Scientist article put it.  The expectation of what Latif terms “monotonic” – presumably meaning “steady” or “linear” – global warming has been set.

Furthermore, as I stressed before, the reliance on Arctic sea-ice as an indicator is unwise, to say the least.  The Guardian’s report of the Met Office’s latest assessment of the evidence gave prominence to the Arctic sea-ice graph yet again yesterday.

The Guardian also included a commentary by a Dr Chris Huntingford, the online title “How public trust in climate scientists can be restored” making a lot more sense than “We need to look beyond temperature” in the print version. Huntingford makes the point that:

“To preserve public confidence, we must ‘buy out’ the copyright from research journals of key papers so that these can be freely available to all for inspection. Datasets must also become more available for general scrutiny.”

Too right. I found myself this week in the British Library accessing a paper by Drs Phil Jones and Ken Briffa, yes that Phil Jones from the CRU at UAE, Dr Emailgate himself.

What I was interested in was what Jones and Briffa term the “Unusual climate in Northwest Europe during the period 1730 to 1745”. Before I report their findings, I’ll explain why I was interested in 1740 in the first place.

The 1740 Anomaly

In my last post I presented a graph of the Central England Temperature (CET) record from 1659 to 2009. I noted the cold winter of 1739-40 which occurred after the famously warm decade of the 1730s, with a run of winters as mild as anything that occurred before the globally warmed world of the last decade (though the 1920s is also comparable).

I wanted to see how anomalous 1739-40 was, so I replotted my graph with a longer running mean. In fact, I did several plots, but let’s consider the one with a 75-year running mean, which smooths out all but long-term temperature trends:
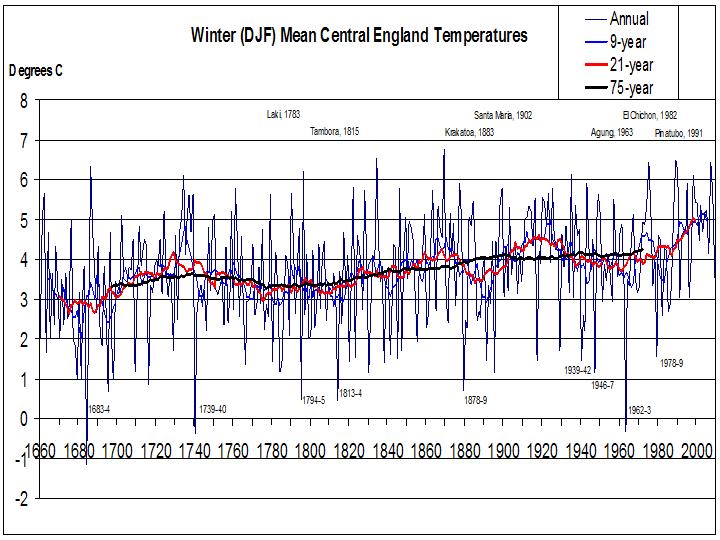
I then calculated the Standard Deviation (SD) of the winter 1739-40 temperature against the 75-year running mean. The 1739-40 winter was 3.14 SDs colder at -0.4C than the running mean (5.59C). A statistical table tells us that we should only expect such an anomalously cold winter about once every 1,100 years.  Yet a couple of centuries later 1962-3 came along and, although marginally milder, this was against a higher 75-year running mean, so was a once in nearly 5,000 years event.  It seems something non-random is going on.

Curiously, the 9-year running mean of winters from 1730-1 to 1738-9 was, at 4.81C, even more anomalous than the 1739-40 winter. It was 3.27 SDs warmer than the 75-year running mean centred on 1735 (3.58C). (Obviously, there is less deviation in 9-year means than of single year temperatures from the long-term mean so the SD is lower). If temperature fluctuations were random and normally distributed, you would only expect a run of 9 winters as mild as 1730-1 to 1738-9 about once in nearly 2,000 years.

So we had a once in 2,000 year series of mild winters followed by a once in 1,100 years cold winter. Curiouser and curiouser…

Curiousest, the annual deviation of the meteorological year Dec 1739 to Nov 1740 is even more significant (and the calendar year 1740 even more so!):
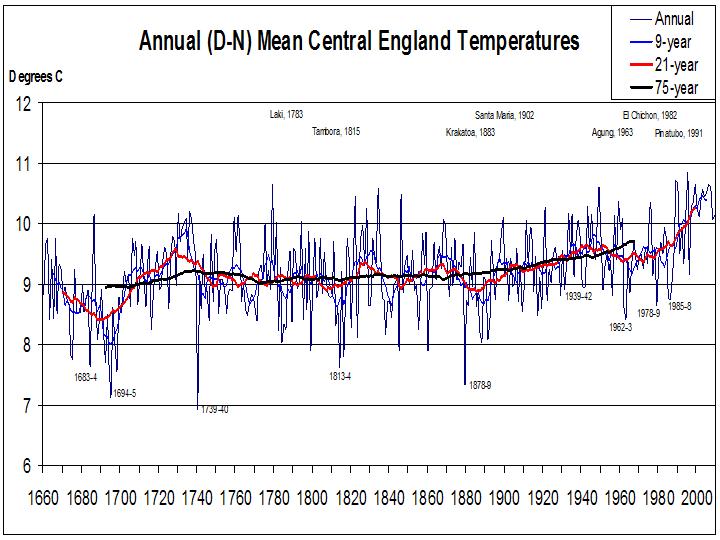
The annual mean temperature for 1740, at 6.93C was 3.72 SDs below the 75-year running mean of 9.21C. That is, a year as cold as 1740 would be expected to occur only once in 10,000 years!

The Jones and Briffa paper

Of course, winter 1740 has not escaped the attention of climate researchers.  It was a catastrophe for Ireland, as J&B note.  But J&B can only scratch their heads, noting in their Abstract that:

“Apart from evidence of a reduction in the number of explosive volcanic eruptions following the 1690s, it is difficult to explain the changes in terms of our knowledge of the possible factors that have influenced this region during the 19th and 20th centuries. The study, therefore, highlights how estimates of natural climatic variability in this region based on more recent data may not fully encompass the possible known range.”  [My stress]

Fascinating though their paper is, J&B merely describe the meteorological conditions that occurred around 1740.  The authors barely speculate on the underlying cause.

It turns out that winter 1739-40 was merely the second in a series of 6 winters when a strong high pressure developed over Scandinavia.  In several of these years this high extended far enough west to block the usual westerlies over the UK.  In the UK and Ireland, the period was generally dry as well as cold.

Lasting Effects of Cold Winters?

The dramatic winter of 1739-40 was just one in a series of 6 atypical winters.  This set me thinking.  We don’t have full instrumental records for 1740, but we do for less dramatic later examples, such as the cooling from around 1940, the start of another series of cold winters.  Here’s a hypothesis: could it be that the entire Northern Hemisphere (NH) could naturally gain heat (over and above underlying global warming) for a few years, which is then dispersed in cold years?

In a cold winter, compared to the normal circulation in the Arctic, air mixes with that from lower latitudes.  High pressure over continental land-masses (Canada, Greenland, Eurasia) pumps warm air further into the Arctic region than usual – Vancouver on the US west coast had a record mild winter for its Olympics this year – cools it and sends it south again – to northern China, the US East coast, and to the East of Greenland.  The Arctic this winter was 7C warmer than usual.

The net effect must be that more heat is radiated away than in a usual winter.   Maybe the climate modellers can calculate how much more.

One thing I can calculate reasonably easily, though, is one of the indirect effects.  I’m taken by the persistence of cold winters.  It follows that – as well as there being more of it – the snow will melt later in the spring.  My weather book (Barry & Chorley) reveals that the NH regions with 4 to 8 months snow cover extend over 10s of millions of square kilometers of NH land areas.  What if 10m km2 snow cover persists for just one extra week?  Besides taking extra energy to melt (which turns out to be relatively insignificant), such a surface would reflect around 50% of incident sunlight relative to a year when the snow cover melted earlier.  At the latitudes (between about 60N and 40N) we’re talking about, a rough, order of magnitude, estimate is that at least 100W/m2 extra energy could be reflected (or used just in melting the snow) for a week.  10m km2 is about 1/25th of the total NH surface, so the snow effect alone is of the order of a negative forcing of around 4W/m2 over the entire NH surface, that is, more than the additional forcing of greenhouse gases, but only for one week of the year.   But if my calculation is too conservative, and in fact it’s several weeks over 20m km2 then we could be talking about a serious feedback.  One cold winter might make it more likely that the next winter is also cold.

Triggers and Feedbacks

I suggested in my previous posts on the topic of the AMO (Atlantic Multi-decadal Oscillation) that the cycle is intrinsic to the system.

Indeed, cyclic behaviour is a feature of ice-sheets.  During the last ice age (and previous ones) there were a number of Heinrich events – discharges of ice-bergs from the Laurentide ice-sheet over Canada.  Brian Fagan in The Long Summer (p.47) gives this description:

“… the ice became thick enough to trap some of the earth’s heat, which thawed the base.  Mud, stones, and water resulting from the thaw allowed the ice to skate, as it were, across the underlying bedrock.  In a matter of a few centuries, Hudson Bay purged itself of the accumulated ice.  Eventually, the ice thinned enough for the cold surface layers to freeze again…  A Heinrich event, then, is a feed-back loop – a quick warming that causes its own end in a quick cooling.” [My stress]

I suggest a much quicker – decades rather than millennia – cycle could take place for Arctic sea-ice, with the common characteristic of “warming causing its own end”.

But it’s not quite as simple as that.

First, cooling events, such as volcanic eruptions which put a sunscreen into the stratosphere, or increased warming – fewer than normal eruptions, or increased greenhouse gas levels – will affect the wavelength of the cycle.  For example, cooling during a warming phase, when the Arctic ice is thinning, will extend the time until the cooling phase.

Second, there will come a point when the system is close to tipping and a sudden cooling event (warming events are more gradual) could trigger the transition from a warming to a cooling phase.

The paper by Jones and Briffa I discussed earlier mentioned an absence of volcanoes around 1740, but my textbook, Barry & Chorley, does include a graphic (Fig 2.11, p.21) showing an unidentified eruption in around 1739 (as well as a couple in the late 1720s and nothing else after 1700).  Perhaps an eruption triggered the 1739-1745 cooling phase.

Alternatively, the turn of the sunspot cycle – i.e. from increasing to decreasing insolation – might provide a trigger.  Barry & Chorley (Fig. 3.2, p.35) show a sunspot cycle peaking in around 1738.  Triggering by a combination of events is also possible, of course.

Once established, a cooling event will be self-sustaining as long as the cooling proceeds faster than underlying warming.  I suspect the thermostat is the Arctic sea-ice.  If warm North Atlantic water melts enough of it again the summer after a cold winter in Europe, then the conditions exist for another cold winter – more cooling is needed to restore equilibrium.  On the other hand, if the ice cover increases, this may be enough to tip the balance back.  Warm water will start to melt the ice from below, starting the cycle again.

I finish with a fairly ad hoc graphic, showing winter temperatures in the CET record against annual and summer temperatures (values adjusted so that the plots appear on the same graph):
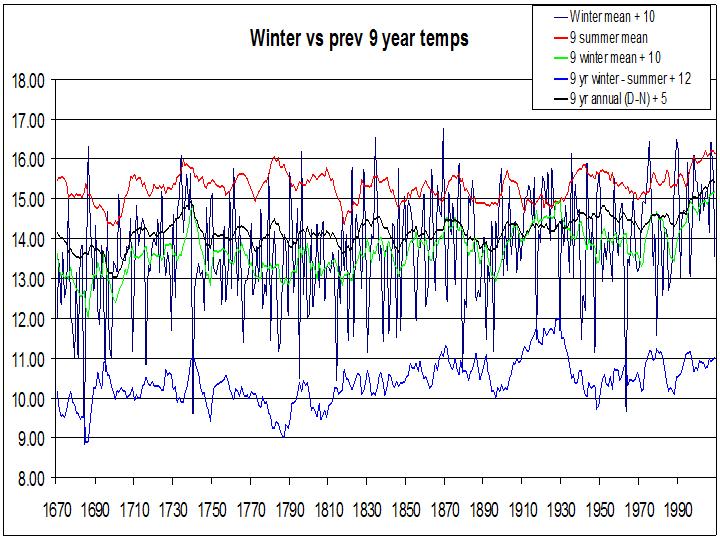
Note the wide fluctuation in the difference between winter and summer temperatures (blue line) which, at 3C, exceeds that of annual, summer or (excepting the period before 1700) winter temperatures which have varied by only 2C.  When the difference is small (i.e. the winter is mild, shown by a larger value in the Figure), as in 1740 and especially the 1930s, and vice versa, this represents an imbalance that must correct itself.  As can be seen in the Figure, the difference at present is small, but the disequilibrium is not as great as in the 1930s.  On the other hand, global warming is expected to moderate winters more than it warms summers…

Because there are so many variables in the system, every cooling event will be different.  I wouldn’t rule out another cold winter next year, though!

———

9/3/10: Corrected serious typo (“even more anomalous than the 1739-40 winter” not “the 1939-40 winter”!)

March 1, 2010

The AMO in the CET?

Filed under: AMO, Global warming, Science — Tim Joslin @ 10:26 am

A couple of weeks ago a commenter suggested I “personally check” the “statistical significance” of “temperature trends”.  Well, I’m not sure that’s really my role in life, but as it happens I did take a peek at the Central England Temperature (CET) record last week to see if I could see any evidence for an AMO (Atlantic Multi-Decadal Oscillation – see previous posts), which hypothetically alternately masks (e.g. ~1940-70) and reinforces (e.g. ~1970-2000) global warming and may even overshoot, producing some cooling.

The CET record is claimed by the UK’s Met. Office to be “the longest available instrumental record of temperature in the world.”  You can download the data here.

My hypothesis is that the AMO drives the Arctic Oscillation (AO) (measured by the NAO or the NAM) which determines the nature of UK winters.  Cold winters, influenced by the high pressure over Greenland and Scandinavia occur during the negative phase of the AO when there is low pressure in the Arctic which itself occurs, I propose, when the Arctic is relatively warmer, as we might expect around the time when sea ice cover is at a minimum (2007 in the current cycle).

A testable prediction might therefore be of cyclic severity of UK winters, as measured by the CET.

The graphs on the Met. Office site only cover the period from 1772, yet the record extends back to 1659.  I therefore found myself importing the raw data into Excel.  Here’s the result of my first plot:

[Btw I just found that, to avoid corrupting its appearance, I had to export the chart from Excel to Word to Powerpoint to a JPG and then import here using WordPress facilities.   Damn you Bill Gates!]

First, a couple of comments about the plot:

  • I’ve included running means calculated for the years either side of a given year (i.e. not trailing).  So, the 21 year mean for 1900, for example, is the mean of the temperatures for 1890 to 1910, inclusive.
  • 2010 data is not yet included – the down-leg at the extreme right is 2009 (average temperature 3.53C).

Clearly statistical analysis will be necessary to prove anything, and I’m sure lifetimes have been spent sifting through this data.  Nevertheless, it is possible to make a few initial observations:

  • There’s no clear evidence of a short-term link between volcanic activity and extreme winters in the CET temperature record (maybe I’ll look at annual temperatures and other seasons another time), with the exception of  a run of cold winters following the eruption of Laki in Iceland in 1783-4.  But there are other similar series of cold winters when there was no volcanic forcing, for example from 1939-42.  Krakatoa (1883) caused measurable global cooling, but occurred in the middle of a run of relatively mild winters in the CET.  Tambora occurred after the exceptionally cold winter of 1813-14, although there is evidence of another major eruption in 1810.  More recently Agung occurred after the famously cold winter of 1962-3 and other eruptions have similarly had little apparent effect on succeeding average winter temperatures in the CET.  This supports the hypothesis that the winter CET record is primarily influenced by weather patterns – central England is mild in winter when the Atlantic influence on the weather dominates, and cold when Continental air flows over the Britich Isles.   Winter temperatures in the CET may therefore be a valid proxy for the Arctic Oscillation, as I proposed at the outset.
  • There appears to be an underlying warming trend in the data.  During the 20th century the 21 year mean always remained around a degree above the low-point in the 17th century.
  • There have been two or three previous periods (e.g. ~1680 – 1730s, 1890s – ~1920) of increasingly milder on average winters as well as that leading up to the first decade of the 21st century (the 2000s).
  • There have been runs of exceptionally mild winters prior to that in the 2000s, though the 2000s were slightly warmer than the antecedents.  The 1730s stand out, but there were also runs of mild winters in the 1910s and 1970s.   In fact, there are so many runs of mild winters that I feel obliged to point out that – if variation in winter temperature were distributed randomly – we would expect 8 milder than average winters in a row to occur only once in 256 years (strictly 256 sets of 8 years which would need 263 years of data – we have 350), 9 once in half a millennium and 10 once a millennium.  Without wishing to commit myself, a closer look at the data may be in order (note that the presentation here slightly underestimates the length of warm and cold sequences, since a 21 year running mean is too short not to be dragged upwards by the series – 8 to 10 mild years – of data we’re looking for).
  • Long sequences of colder than average winters seem to be rarer than those of mild winters, but maybe this is because cold winters tend to represent a larger deviation from the mean than do warm winters.
  • There are cases (e.g. 1739-40, 1962-3) of exceptionally cold winters occurring soon after milder periods and of mild winters (e.g. 1685-6, 1795-6) following cold ones.  Perhaps the first question to ask is whether the data is random.  If it’s not, then we can start to try to work out what sort of oscillations there are in the system.

Blog at WordPress.com.