I read in this morning’s Metro that “it looks certain to be the coldest March since 1962”. The Mail chips in with: “The appalling weather over the past few weeks is set to make this month the coldest March in 50 years.”
This puzzled me a little since I noted only on Wednesday (and published only yesterday) that:
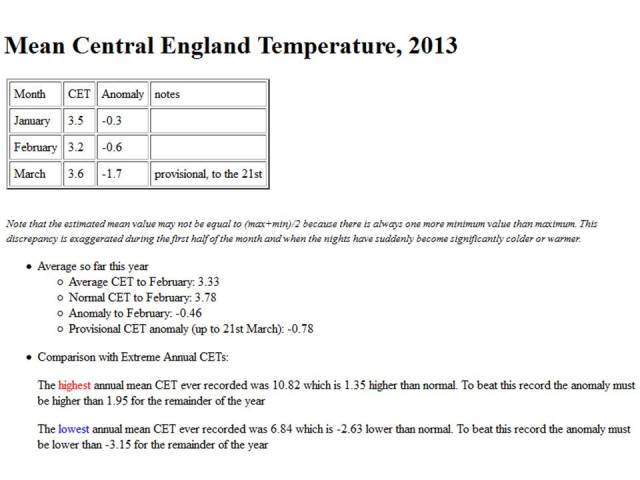
“…we have to go back to 1970 for the most recent March with an average CET of less than 4C, when 3.7C was recorded. It’s possible this March could even beat that mark.
But March 1969 was even colder at 3.3C. I doubt the figure for this year will come out below that. Most likely the headlines will be ‘coldest March for 44 years’.”
This passage is a little garbled because I only said it was “possible” this March could be colder than the 3.7C in March 1970 in the Central England Temperature (CET) record, yet implied that it would when I said it was “[m]ost likely” to be the “coldest March for 44 years”. I think I probably meant to write “for 43 years”, and could have added “with a possibility of it being the coldest March for 44 years”.
Over the last few days the forecast for the rest of the month has certainly turned decidedly wintry, as I discussed in my previous post, and even more so since I wrote, but is it now “certain” this March will be colder than in 1969?
CET vs UK Average Temperature: Comments on a BBC Assessment
A possible reason for my less bold temperature prediction is that the CET will turn out differently from the UK as a whole or for different regions. I’ve been assuming the CET is representative of the UK as a whole, but that might not always be the case.
In the absence of a contribution on the topic on the Met Office’s official blog, perhaps the BBC is the most authoritative source on weather statistics, being less inclined to hyperbole than most of the print media.
A post by John Hammond of the BBC suggests some slight differences between the UK figure and the CET. I assume Hammond is using the UK temperature because his figures are lower than the CET equivalents (and his figures tally with graphs available on the Met Office site – see below). He writes that:
“So far, March 2013 has been colder than both this winter’s December and January. The average temperature (day and night combined) for the UK this March to date is currently around 3C. It should normally be nearer 6C.”
The claim that March 2013 has “[s]o far” been colder than January is not true for the CET:
since January averaged 3.5C and so far March is 3.6C in the CET (rather than “around 3C”). The 3.6C figure for March was published in the last hour (as I type, rather than as I publish) – we’ll come back to the fact that the March figure has actually come down from 3.7C when Hammond was writing on Wednesday or Thursday.
Hammond goes on to say:
“…the coldest March on record was in 1962, when the mean temperature staggered to just 1.9C. That record will not be broken this year, but the more recent cold March of 1987 looks under threat – its mean temperature was 3.3C.”
not mentioning 1969 and 1970, for which the CET March temperatures fall between those in 1962 and 1987. This is a little odd since the same is true for the UK as a whole, which is what Hammond’s data seems to relate to. To admit my ignorance, I don’t know how to access the actual UK figures (maybe I should ask the Met Office), but I do know how to plot them graphically from a handy Met Office page:
Note the cold Marches in 1969 and 1970, which Hammond doesn’t remark on. Maybe that’s an oversight.
So, will it be colder this March than in 1969?
Since the media are so sure March 2013 will be the coldest “for 50 years” (meaning 51), let’s have another look.
The first point to note is that the average so far this month, up to and including the 21st, is 3.6C. As I mentioned, it was only 3.7C to the 19th and the 20th. In terms of record-breaking, this could be enough to make a difference.
The second point is arithmetical. If one of the remaining 10 days this month (22nd-31st) is 2-3C below the current average (3.6C), the mean for the month will decrease by 0.1C; if a day is 2-3C above the average so far the mean will increase by 0.1C. This is admittedly a crude reckoning system, but simple and effective.
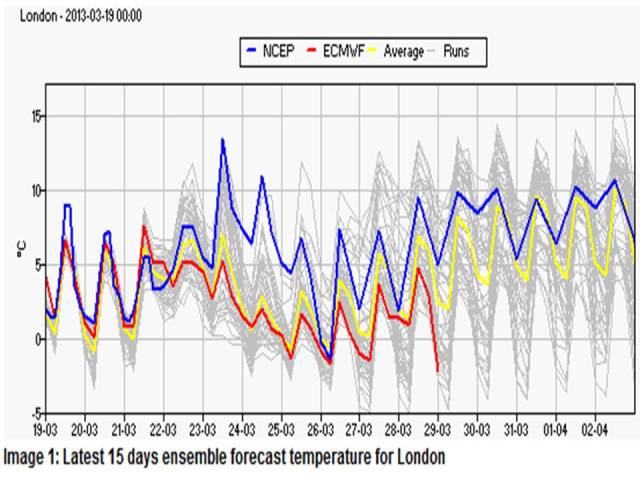
Third, taking the Heathrow temperature as typical of the Central England region as a whole, the medium term forecast has been deteriorating. This was the main theme of my previous post – perhaps I didn’t take enough account of it when discussing the monthly record temperatures.
This is what the forecasts looked like a couple of days ago (thanks Weathercast):
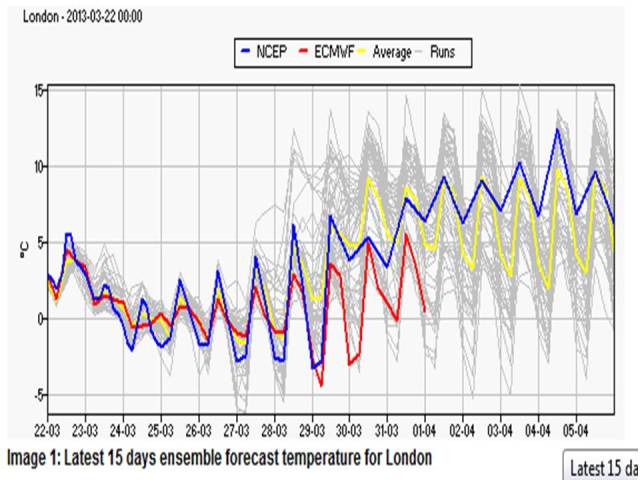
and this is the latest graph:
The forecasts do seem to have deteriorated even further than I discussed in my previous post.
Ignoring today (22nd) as transitional, it now looks likely that the 5 days 23rd through 27th March will be seriously cold, so let’s knock 0.1C off the monthly average for each of them. That gets us down to 3.1C.
The 28th will most likely be around the new average (3.1C), so it all depends on when the mild air comes in from the Atlantic. The computer model runs (grey lines) differ, and the average (yellow line) for 30th and 31st are for it to be relatively mild. If that’s the case, then we’d need to add on 0.1C for each day, so would roughly equal 1969.
The grey lines represent an ensemble of forecasts, I assume each less precise than those generating the published maps. If we go on the basis of the main model runs (the red and blue lines), of which the ECMWF (red line) seems to me to have been best at predicting the “battle” between cold easterly and mild westerly air this winter (as in fact exemplified by the pair of Weathercast graphs above), then it looks fairly cold through almost to the end of the month.
The balance of probabilities does seem now to suggest that March 2013 will be the coldest in the CET since 1962. Most likely, the Metro, the Mail and John Hammond of the BBC will be proved right.
It might be worth noting that if the CET this month is lower than not just 3.3C, but the 3.2C recorded in both 1917 and 1955, it will not only be the coldest March in the series since 1962, but the second coldest since the 19th century. This is where the CET is useful – it gives a longer historical perspective than the UK figures, which only go back to 1910.
I suppose it’s not outside the bounds of possibility that we’ll beat that 1962 figure of a March CET of 2.8C, but that remains very unlikely.
All this may seem nit-picking, but if we’re going to make claims about increased frequency of weather extremes – and policy based on those claims – it’s essential to be clear what the data is telling us.


[…] of March. Of course, this has a bearing on where March 2013 will rank among the all-time coldest, which I discussed in my previous post, but I’ll have to find time to revisit that subject in the next day or […]
Pingback by The UK’s Cold March 2013 and the Perils of Ensemble Forecasting | Uncharted Territory — March 25, 2013 @ 4:26 pm
[…] is moreorless in line with my projection of a few days ago. But that was based on ensemble forecasts on 22nd March, and, as I noted yesterday, the forecast […]
Pingback by March 2013 in UK: Coldest in CET since 1892 or 1883? | Uncharted Territory — March 26, 2013 @ 7:23 pm